✍️ By Muhammad Hashir · Founder, NextGen Calculators
It was 10:47 PM on a Tuesday in January. My daughter had already set her alarm for 6:15 AM — school bag packed, lunch ready. My son, meanwhile, was absolutely convinced school would be cancelled because he had checked the app. The forecast said four inches overnight. He was certain. She wasn’t buying it.
She was right. School ran on time. My son was baffled.
That gap — between what a weather forecast says and what a school superintendent actually decides — is exactly the problem that snow day calculators are built to solve. But most people who use them don’t understand what’s happening under the hood. And that misunderstanding is what leads to disappointed kids, scrambled morning plans, and unnecessary arguments at 11 PM.
Let me walk you through how these tools actually work, what data they’re pulling, and — critically — why the same four inches of snow produces wildly different outcomes depending on where you live.
1. A Snow Day Calculator Is Not a Weather App — It’s a Decision Model
This is the single most important thing to understand, and it changes everything about how you interpret that percentage on your screen.
A weather app answers one question: What will the atmosphere do tonight?
A snow day calculator answers a completely different one: Given what the atmosphere is about to do, what will a superintendent in your specific region decide?
Answering the second question requires weather data, yes — but it also requires years of school closure history, regional infrastructure knowledge, an understanding of local road treatment capacity, and a calibrated model of how administrators in different parts of the country respond to similar conditions.
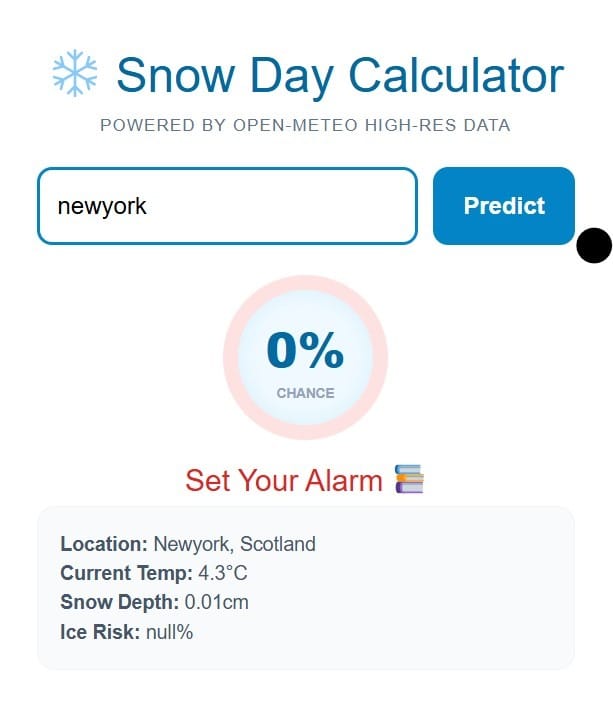
A 40°F road surface with light freezing drizzle and a quarter-inch of accumulation will shut down every school in Atlanta. That exact same event in Minneapolis doesn’t even generate a two-hour delay. Both outcomes are completely rational — they reflect different infrastructure realities, different driver experience in winter conditions, and different institutional risk thresholds built up over decades. Any tool that doesn’t account for this regional variation produces numbers that look precise but aren’t meaningful. This tool is mostly for students and teachers who want to go to school, college or university and to confirm is there any snow at specific time or not.
2. The Key Variables That Actually Drive School Closure Decisions
When a superintendent makes the final call at 4:30 AM, she isn’t looking at one number. She’s working through a mental checklist refined over years of experience. A reliable snow day calculator models that checklist — not just the weather forecast.
Road Surface Temperature at the Time Precipitation Starts
This is the variable most people never think about, and it’s one of the most predictive. Whether snow packs or melts, whether drizzle freezes instantly or runs off — all of it depends on the temperature of the pavement itself, not just the air temperature.
Road surfaces retain heat differently than ambient air. A day that peaked at 38°F leaves pavement significantly warmer heading into overnight hours than a day that peaked at 26°F. The same 28°F air temperature at 2 AM produces very different road conditions depending on what those roads were doing at 6 PM. Quality prediction tools pull road surface temperature data from state DOT sensor networks where available — data your weather app never shows you.
Precipitation Type Versus Precipitation Amount
Four inches of light powder arriving at 2 AM and stopping by 4:30 AM is a manageable event for most mid-Atlantic and Midwest districts. A half-inch of freezing rain arriving at the same time is a crisis.
The reason is physics. Fluffy snow compacts under traffic, provides friction, and can be plowed relatively quickly. Freezing rain coats every surface — roads, bus steps, parking lots, sidewalks — in a layer of glassy ice that doesn’t respond to simple plowing. It requires chemical treatment, extra time, and in many cases simply doesn’t improve enough before buses need to roll. When you see a low-accumulation forecast paired with a high closure probability, the tool is almost certainly detecting freezing rain in the mix.
Storm Timing and the Critical 2 AM to 5 AM Window
Transportation directors work around one fixed constraint: buses need to depart by roughly 6:15 AM to 6:45 AM to complete their routes before first bell. That means roads must be passable during that window — not perfect, just passable.
Storm timing relative to that window is enormous. Snow finishing at midnight gives road crews four to six hours to treat and plow. Snow actively falling at 5 AM gives them essentially nothing. Two storms with identical total accumulation but different peak timing can produce completely opposite closure outcomes. Good prediction tools model the overlap between storm intensity and the morning bus departure window specifically — asking how much active accumulation will occur during the 30-minute period when road conditions matter most.
Wind Chill and the Student Safety Threshold
Most states have informal or formally codified guidance around student safety at outdoor bus stops. When wind chill drops to the point where waiting creates a genuine hypothermia or frostbite risk — especially for elementary-age students — districts have a safety obligation that goes well beyond road conditions.
This is how “cold days” happen: closures where roads are fine but the felt temperature is -15°F and rural students would be standing at exposed roadside stops for up to 25 minutes. A calculator that only processes snowfall accumulation will miss these closures entirely.
3. Why Regional Calibration Separates Reliable Tools from Noise
One inch of freezing rain closes every school in Birmingham, Alabama. In Buffalo, New York, that same event doesn’t delay a single class period.
Neither outcome is irrational. Buffalo averages more than 90 inches of snowfall annually. The infrastructure — road treatment contracts, plow deployment logistics, the institutional memory of a transportation department that has managed heavy winters for decades — is built for it. Drivers know how to handle winter roads. The risk calculus is genuinely different.
A district in the Southeast encounters severe winter weather infrequently. Road treatment resources are proportionally smaller. Driver experience in icy conditions is lower. The responsible closure threshold is lower because the actual risk, given those conditions, is materially higher.
A prediction tool applying the same national model to both cities is producing a fiction. Regional closure threshold calibration — built from years of district-specific closure history — is what separates accurate tools from noise. When evaluating any prediction service, this is the only question that matters: does it explain how it adjusts for your location, or does it simply assert a national accuracy number?
4. Why Snow Day Calculators Never Show 100%
You’ll notice that reputable prediction tools cap their output somewhere between 95% and 97%. That ceiling isn’t false modesty — it reflects something real about how closure decisions actually get made.
What the Algorithm Can’t Access
No algorithm has access to the 4:45 AM phone call between a superintendent and her county roads director. No model knows that three bus drivers called in sick overnight, tipping the operational calculus toward closure on a day that might otherwise have run. No tool can predict that a water main broke at the middle school at 3 AM, which made the closure call easy.
The percentage a calculator gives you represents the probability that atmospheric and historical conditions align with a closure. It doesn’t — and can’t — account for the operational and logistical factors a human decision-maker is simultaneously weighing. The ceiling exists because honesty about uncertainty is more valuable than false precision.
What a High Percentage Actually Communicates
When a tool shows 85%, that means there is still a meaningful 15% chance that something in the human decision-making process goes differently than conditions would predict. That’s not a flaw in the tool. That’s the tool working correctly. A probability is not a guarantee — and any prediction service implying otherwise is overstating what the data can actually support.
5. The Remote Learning Variable Most Tools Still Miss
Here’s something that changed significantly after 2020 and that most prediction tools haven’t fully incorporated: the virtual snow day.
Before remote learning infrastructure was widely in place, the choice was binary — school runs or it doesn’t. Now a substantial number of districts have a third option: shift to online instruction. Technically not a snow day. Technically not a regular in-person school day. A hybrid outcome that sits in between — and one that the binary closed/open output of most calculators can’t capture.
What to Do When Your District Has a Remote Learning Policy
A tool showing 65% is probably accurately detecting that in-person school is unlikely. But if your district has an active remote learning protocol, that 65% might mean a virtual day rather than a true day off. The distinction matters enormously if you’re trying to determine whether your kids need active supervision or just a charged laptop.
The practical step: if your district has issued any remote learning policy in the past three years, check their official website alongside any prediction tool you’re using. The calculator models the data. It cannot read your district’s operational playbook.
6. How to Read Your Snow Day Calculator Output Like an Expert
The Two Check Windows That Actually Matter
The accuracy curve on any prediction tool is not flat throughout the day. Checking at 2 PM the day before a storm gives you a rough planning signal, not a reliable prediction. Forecast models haven’t yet run their final overnight cycles, and afternoon road surface data tells you very little about pavement conditions at 4 AM.
The two meaningful windows are: 9 PM to 10 PM the night before, when overnight model runs have completed and the tool has ingested the most current storm track and accumulation data; and 5 AM on the morning itself, when actual overnight accumulation, observed road conditions, and active county road reports have all fed into the calculation.
A 9 PM check gives you enough lead time to arrange backup childcare before options disappear. A 5 AM check delivers the highest-confidence read — typically 30 to 45 minutes before official district notifications go out.
What Each Probability Range Is Telling You
Understanding the range is more useful than fixating on the exact number.
Below 30% — Current conditions don’t support a closure. Set your alarm and plan normally unless a significant late-breaking storm shift is still developing.
30% to 60% — Genuine uncertainty. A tool showing this range is doing its job honestly. Prepare both outcomes in parallel without committing to either.
60% to 75% — Conditions lean meaningfully toward closure. This is the range where confirming — not just identifying — a backup childcare option becomes worth the extra effort.
Above 75% — Historical and real-time data are aligning strongly toward a closure call. Not a guarantee, but the weight of evidence is significant.
Above 90% — The data is as confident as it gets. You’d need an unusual last-minute ground-level development to change this outcome.
How to Add NOAA Data for an Even Stronger Signal
Cross-reference whatever percentage you’re reading against NOAA’s active winter weather classifications for your area. A prediction of 72% under a Winter Storm Warning from the National Weather Service carries a materially different weight than 72% under a Winter Weather Advisory. The Warning means NWS forecasters are already expecting significant impact — that external anchor gives the calculator’s output additional credibility.
The combination of a well-calibrated prediction tool and an active National Weather Service warning is the most reliable signal available to anyone who isn’t a meteorologist trying to plan around a winter event.
7. The Real Value Is Timing, Not Just the Number
The percentage output matters — but it’s almost secondary to what a good prediction tool actually delivers: time.
The ability to know by 9 PM what you’d otherwise learn at 5:30 AM is genuinely valuable. That eight-hour window means working parents can line up childcare before providers book up. It means employers can manage remote-work logistics before the morning scramble. It means families can make real decisions the night before rather than reactive ones at sunrise.
A reliable high-confidence prediction at 9 PM is worth more than a confirmed answer at 5:30 AM when your options are already limited. Used at the right check windows, interpreted with the right framework, and cross-referenced against official sources, a well-built snow day calculator isn’t a novelty. It’s a planning tool that converts atmospheric uncertainty into actionable lead time.
My son, for the record, has since learned to enter his ZIP code instead of assuming four inches automatically means a day off. He still wants school cancelled every time it clouds over in November. Some things the algorithm can’t fix.
FAQ
How does a snow day calculator predict school closures?
It combines live weather data — road surface temperature, precipitation type and timing, wind chill projections — with historical closure patterns specific to your region. The tool translates atmospheric conditions into a probability that a superintendent in your area would call school off, based on how that district has responded to similar conditions in the past.
Why did the calculator show 80% but school stayed open?
An 80% probability still carries a 20% chance that school runs. A last-minute county road report, an unexpected improvement in overnight conditions, or an operational decision by the district can change the final call. The tool wasn’t wrong — probability worked exactly as stated. High probability is not a guarantee.
Is a snow day calculator more accurate than a weather app?
For predicting school closures specifically, yes — because it’s asking a different question. A weather app forecasts atmospheric conditions. A snow day calculator models how a human decision-maker in your specific region will respond to those conditions. The weather data is just one input into a much more contextual prediction.
What time should I check the snow day calculator?
Check at 9 PM to 10 PM the night before for a reliable planning window, and again at 5 AM on the morning of the storm for the highest-confidence read. Early afternoon checks are rough signals only — the most predictive data hasn’t loaded yet.
Can snow day calculators predict two-hour delays?
Most tools model a binary outcome: open or closed. Delay predictions are significantly less accurate because the delay decision hinges on fine-grained judgment about how rapidly roads will improve through the early morning hours. Full-closure predictions are the reliable core use case.
Why does the calculator never reach 100%?
Because the final call is always made by a human who may factor in information no algorithm has access to — a late-arriving road report, a staffing shortage, a building issue. The ceiling exists because accurately representing uncertainty is itself a form of reliability.
Conclusion: The Logic Behind the Number
A snow day calculator is doing something genuinely sophisticated: translating raw atmospheric data into a prediction about human decision-making within a specific regional context. That translation — from weather conditions to superintendent behavior — is where the complexity lives, and it’s what separates a serious prediction tool from a weather app with a school label on it.
The key variables are road surface temperature, precipitation type, storm timing relative to the bus departure window, wind chill thresholds for student safety, and the district’s historical closure patterns. The percentage reflects how all of these combine against a baseline of what has actually happened in your area under similar conditions.
Check at 9 PM for planning. Check again at 5 AM for the final call. Cross-reference with NOAA classifications. Account for your district’s remote learning policy if one exists. And understand that no tool reaches 100% — not because it lacks precision, but because honesty about the limits of prediction is itself a form of accuracy.
Ready to see your live prediction right now? Head over to the NextGen Snow Day Calculator — enter your ZIP code and get a hyperlocal closure probability calibrated to your region’s actual history.